
Dashboard
The headline numbers for your store, covering lifetime sales, today, this month, and average order value.
The Dashboard is the first thing you see when you open a store. It answers one question fast: is the store doing better or worse than it was?
Dashboard → Analytics → Dashboard, the sidebar's home item. No permission is needed to open it, so every team member sees it, and it's on every plan — but the revenue figures on it need stats_revenue_read and are blurred without it. Deeper reporting lives in Analytics, which needs a paid plan.
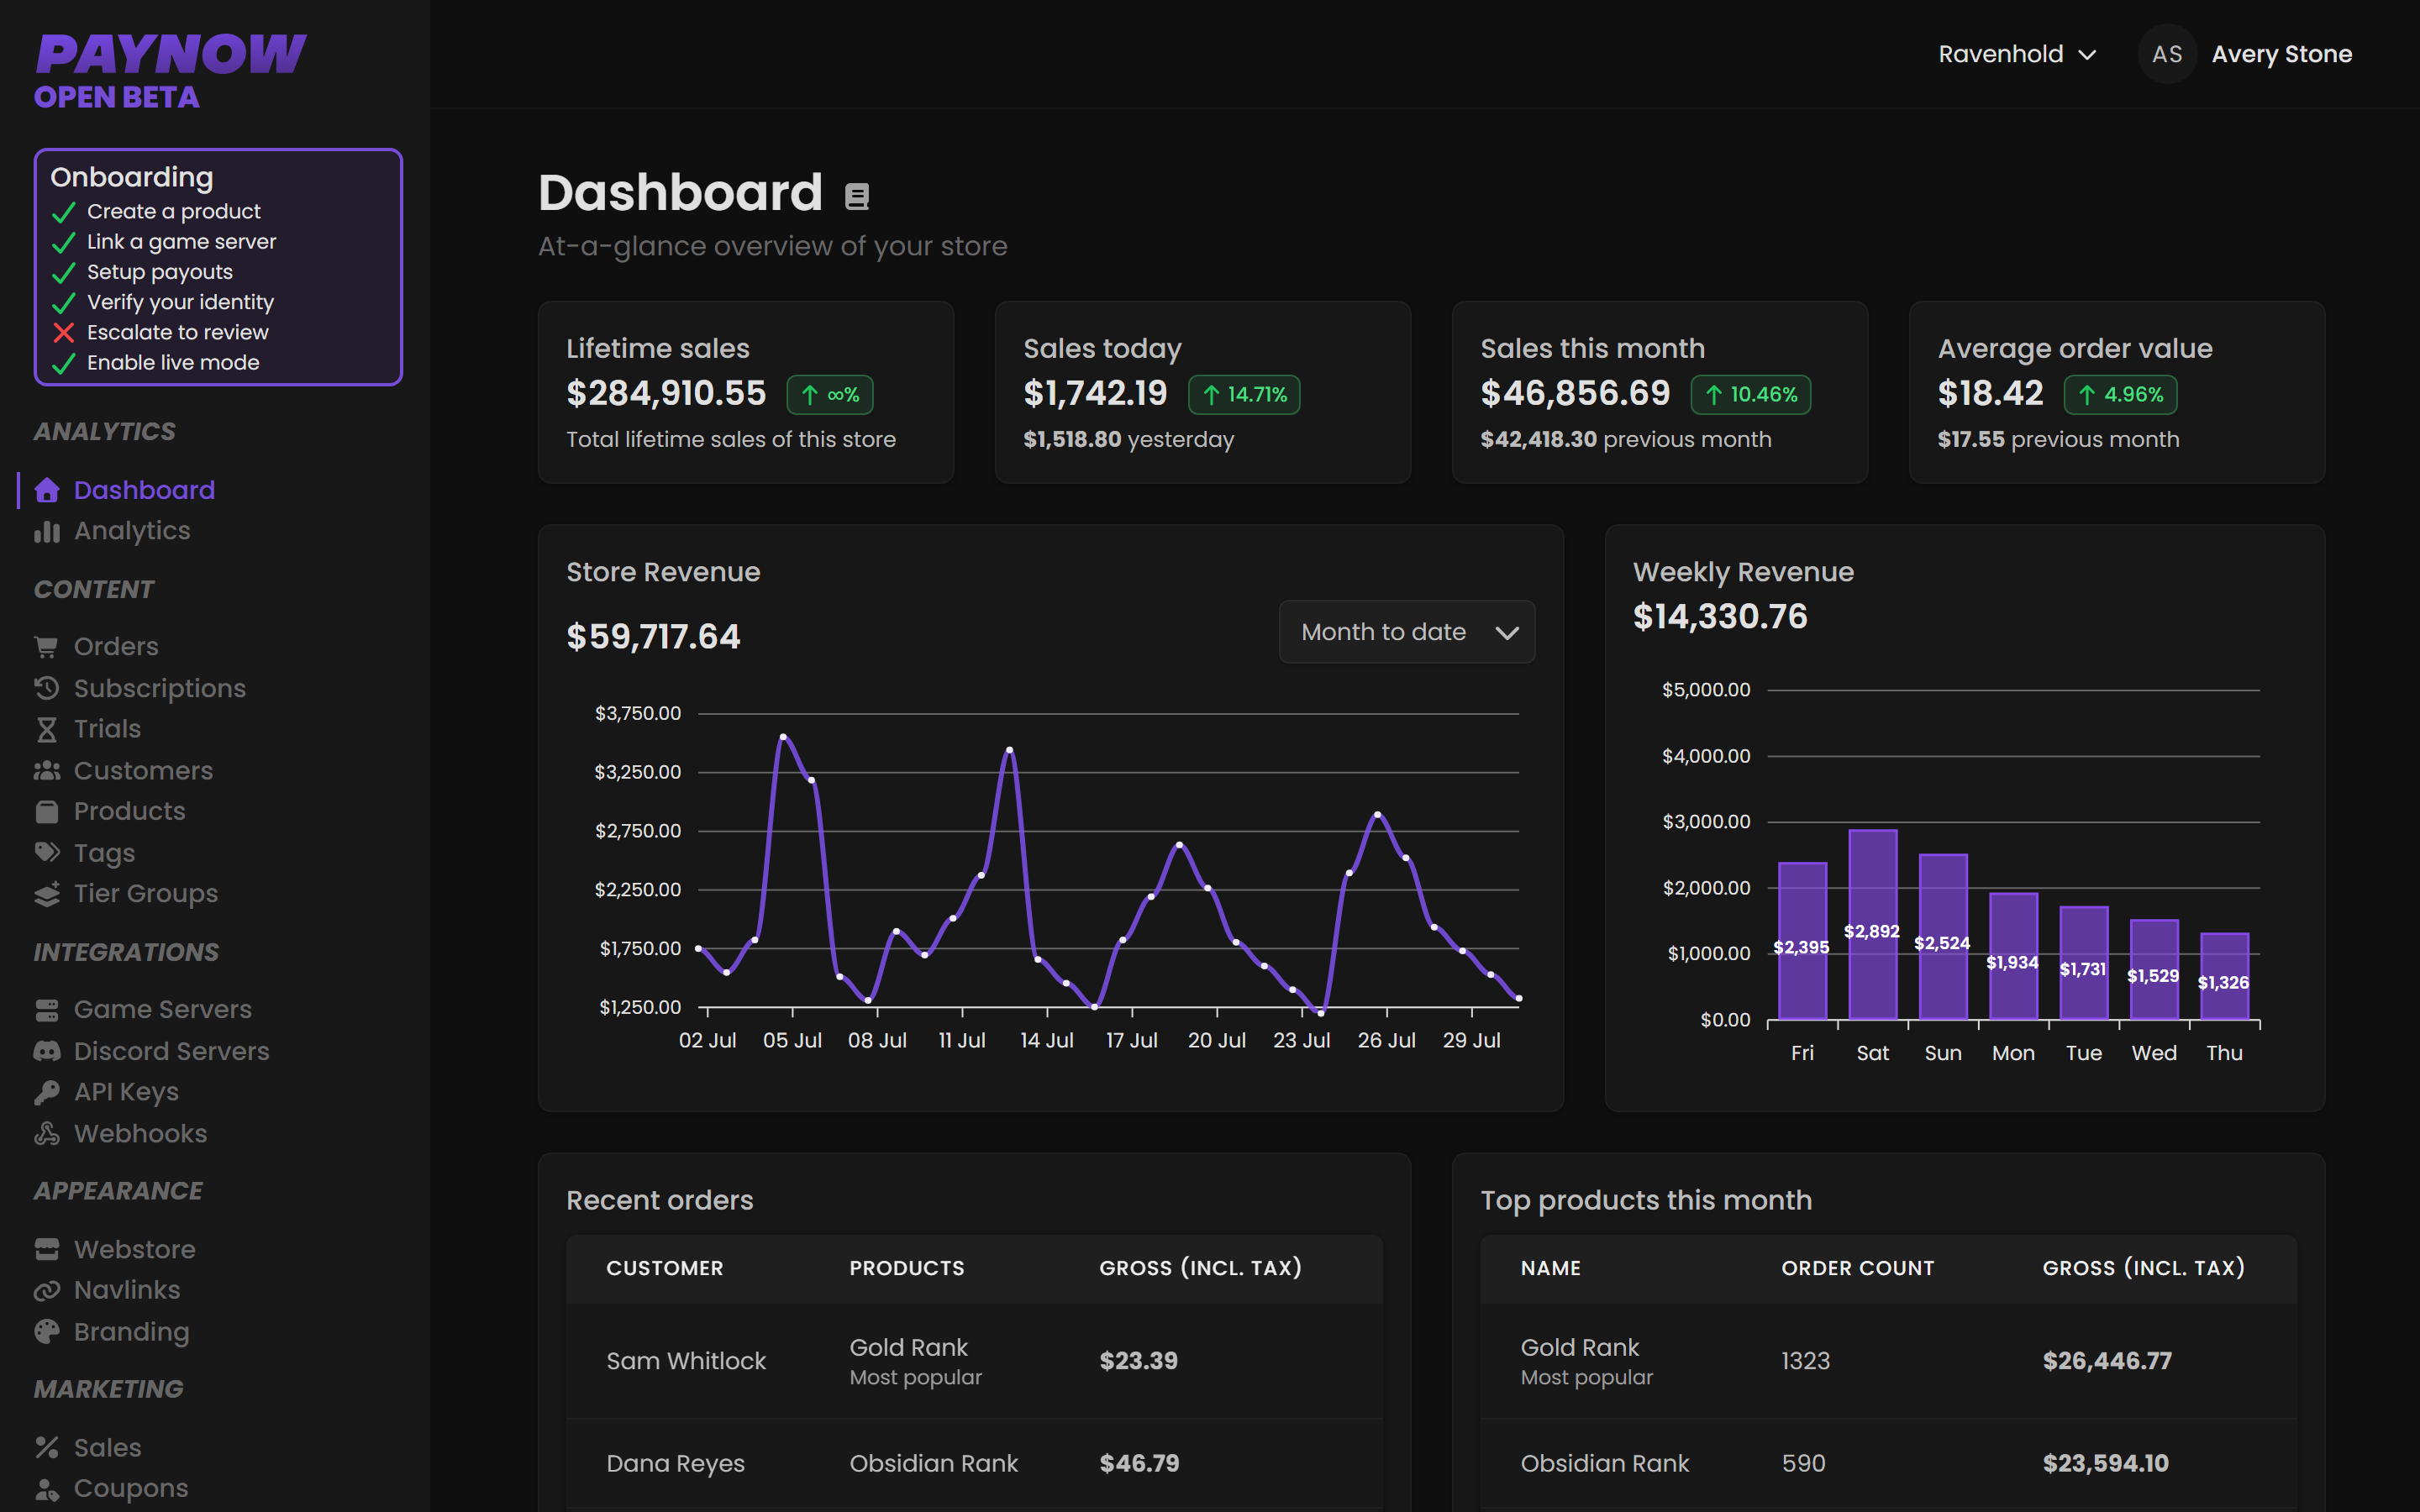
The headline tiles
| Tile | What it means | What to watch for |
|---|---|---|
| Lifetime Sales | Total earnings since the store opened. | A vanity number day to day, but the one to quote when valuing the store or negotiating with sponsors. |
| Today | Earnings so far today. | Compare against the same weekday last week, not against yesterday. Game store revenue is strongly weekly. |
| This Month | Earnings month to date. | Pace it: at day 10 of 30, you should be near a third of last month's total. |
| Average Order Value | Mean value per order. | The number most within your control. Upselling and Tier Groups move it directly. |
These are sales figures, not payout figures. They show what customers paid, before tax, gateway fees and platform fees. What actually reaches you is the Net figure on Transactions. Expect a sizeable gap, most of it tax.
Charts
Weekly Revenue shows the shape of your week. Most game communities peak at weekends and after content updates. Once you know your own shape, schedule Sales and announcements to land just before a peak rather than during a trough.
Sales Today is a live tracker, useful during a launch or sale and largely noise otherwise.
Top products this month tells you what is carrying the store. One or two products commonly account for most revenue. Check it before you spend a weekend building a third.
Reading it well
Compare like with like: weekday against the same weekday, month against the same month last year if you have the history. Raw day-on-day comparisons mislead.
Expect a spike then a decay after any promotion, so judge a sale on the full week. A flat month isn't a bad month if your subscriber base is growing, because recurring revenue shows up as stability before it shows up as growth. Average order value falling while orders rise usually means a discount worked but ate the margin.